1. Introduction
In 2017, I did a school project (which is located here) on trajectory clustering because I had a civil flight dataset, and I thought it would be cool to do a project on this dataset. The project was okay; I pushed it to Github and forgot about it. After some time, it started getting some attention, and still, I'm getting emails asking about specific parts of the project. One reason might be that, except for scientific papers, there aren't many good tutorials on the subject of trajectory clustering. All clustering tutorials use fixed dimensional points to show the clustering methods. However, it's not very easy to apply that logic to trajectories. Hopefully, this post will shed some light on some technical details of trajectory clustering. This post is not a comprehensive tutorial; it is supplementary to other introductory clustering tutorials. I'll assume that the reader has some fundamental knowledge of clustering methods.
2. Trajectory Representation
The standard way to represent a trajectory is to get sample points with regular intervals, as shown in Figure 1. \(p_i\) is the \(i\)th point in the sequence. If the sample rate is not constant, we can embed timestamps into the sequence such as \(\langle (p_1, t_1), (p_2, t_2) \cdots, (p_d, t_n)\) where \(t_i\) is the timestamp of point \(p_i\). The chance is that your dataset is already in this format or can be converted to this format. For example, if we have video footage of a dog running on a field, we can capture the dog's position in each frame and have a sequence of points. Although we show the length of the trajectory (the number of points in the sequence) with \(d\), it is not necessarily the same for all trajectories. They may have varying lengths.
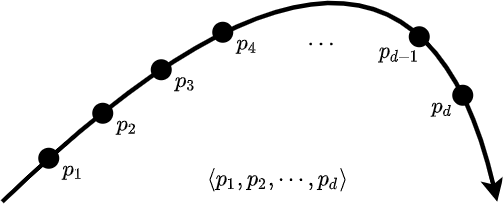
Figure 1. An example trajectory representation
3. Distance Matrix
Many clustering methods rely on calculating the pairwise distance of entities. The methods can compute distance values on the fly, or those values can be computed beforehand and given as an input to the clustering methods in a matrix. After calculating the distance matrix, the domain of the problem becomes irrelevant in the eyes of clustering algorithms. They don't care if you're clustering trajectories, simple points, or dog paths.
One possible way to calculate the distance of two trajectories is using the Hausdorf distance function. The formal definition is given below. \(A\) and \(B\) represent the trajectories. The function \(d\) is the inner distance function that calculates the distance between two points, such as euclidian distance. The definition is not easy to understand from the equation. I visualize it as matching points of one trajectory to points of other trajectories as close as possible. Then, we return the distance of the worst matched pairs.
This is not actually a distance function because it's not symmetric: Even though \(p_a \in A\) is closest to \(p_b \in B\), \(p_b\) may not be the closest point to \(p_a\) in trajectory \(B\). For this reason, we calculate the other way around as well and return the max of them.
Please refer to this excellent page written by Normand Grégoire and Mikael Bouillot. It has an illustrative example showing the calculation steps one by one.
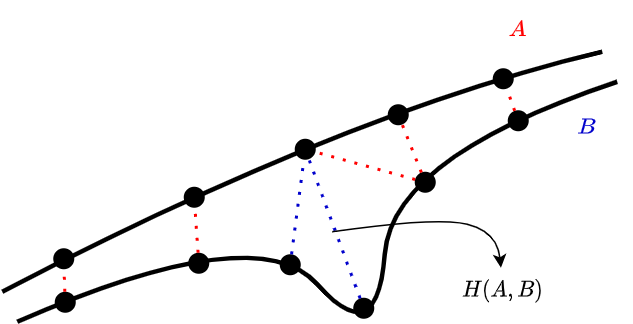
Figure 2. Hausdorf distance example
This metric heavily punishes outlier points. It may or may not work for you. For example, If you're looking for any unusual activity in flight trajectories, this distance metric makes sense. If it doesn't, you can use a different distance metric. You may want to look at this survey [1], which compares various distance measures.
I want to add a small note about the inner distance function \(d\). Since trajectories are a significant part of geographic information systems, \(p_a\) and \(p_b\) might be geographic coordinates instead of points in a 2D space. If that's is the case, the euclidian distance cannot be used directly as the inner distance function. Instead, Haversine distance should be used. Or, the coordinates should be projected on a 2D euclidian space first, and then we can use euclidian distance.
4. What if trajectories are too long
Most computing time is spent on calculating distances. If your trajectories contain too many points, it may significantly hurt the performance. One way to solve this issue is to reduce the sampling rate. For example, If you have a trajectory like \(\langle p_1, p_2, p_3, p_4, \cdots, \rangle\), you may drop all even indexed points to get \(\langle p_1, p_3, p_5, p_7, \cdots, \rangle\), which corresponds to decreasing the sampling rate by half. The drawback of this approach is that you may lose some crucial points in the process. Here, we want to remove most of the points while retaining some important ones.
Instead of decreasing the sampling rate, I suggest the following procedure to reduce the size of trajectories: First, we choose an angle threshold \(\epsilon\). If the trajectory doesn't change its direction larger than \(\epsilon\) on some subsequent points, we remove them but we always keep the first and the last points.. This idea is depicted in Figure 3. You can always sample some trajectories and check how much information is lost due to these trajectory-reducing methods.
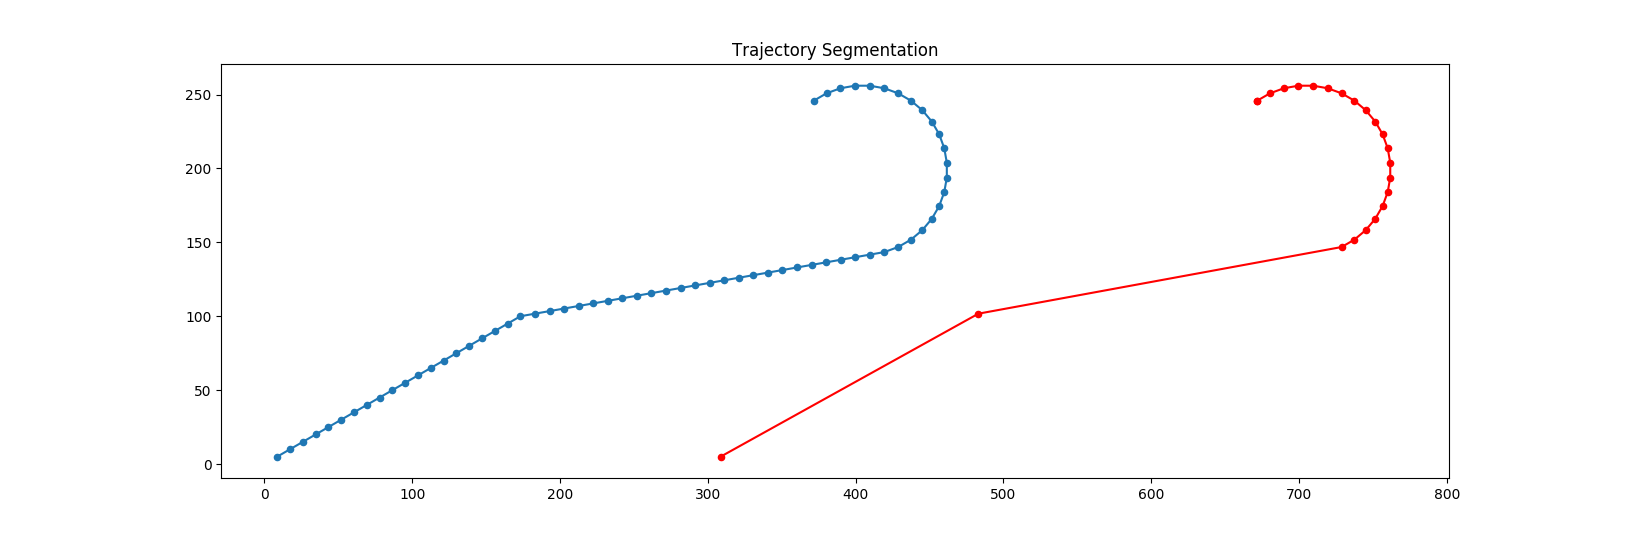
Figure 3. Trajectory optimization by removing insignificant points
5. What if the distance matrix is too big
If we have \(n\) trajectories, the size of the distance matrix will be \(n \times n\). Due to this quadratic storage cost, the matrix may not fit into the main memory. The solution to this problem is using a sparse matrix format. Refer to the corresponding Wikipedia page for more information on sparse matrix formats.
If trajectory A and B are very distant from each other, we may not need to know the exact distance value; we can simply regard that number as infinite. More precisely,
if H(A, B) > distance_threshold:
  M[A, B] = inf # just for demonstration, we don't actually store these in the memory
else:
  M[A, B] = H(A, B)
The question is how can we determine the distance threshold. It should be clear for some algorithms like DBSCAN because DBSCAN requires this threshold value as a parameter. For some other algorithms like k-medoids, the decision is not as easy. We should roughly know how close points will be in the resulting clusters. To be safe, we can set the maximum threshold value that gives a small enough distance matrix to hold in the main memory.
Also, if you're using 3rd party libraries to cluster trajectories, you need to check if they support sparse matrices. In my project, I had to tweak the code of some of the methods to tell the algorithm that missing values in the matrix represent infinite values.
6. Direction and speed
As you may have noticed, the representation and the distance function I've shown don't respect the direction or speed of the object. You can use any permutation of \(\langle p_1, p_2, \cdots, p_n \rangle\) and still get the same distance values. Or, the trajectory of a dog running around and the trajectory of a snail can be the same. To let the models consider direction and speed, we can embed them into our point representation, \(p_i\). We may say \(p_i\) is a four-dimensional point such that \(p_i = (x_i, y_i, \alpha_i, v_i)\) where \(x_i\) and \(y_i\) show the position, \(\alpha\) is the direction and \(v_i\) is the velocity. However, these measurements are not comparable, so we need to decide how much 1 unit difference in direction or velocity affects the distance compared to 1 unit difference in position. We should adjust it correctly; otherwise, the model gives some features too much or too little importance.
7. Conclusion
The project I mentioned is located here. Drop a comment below if you have any questions.
References
- Su, H., Liu, S., Zheng, B., Zhou, X., & Zheng, K. (2020). A survey of trajectory distance measures and performance evaluation. The VLDB Journal, 29(1), 3-32.
Comments